One of the interface groups on the main control panel is the system health group.
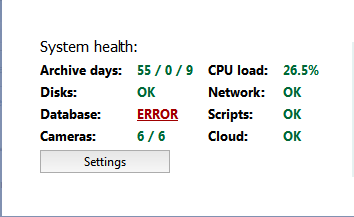
System health - shows server performance measurements for rapid detection of critical server errors:
- Archive days – The current depth of the archive's main stream / privileged channels / auxiliary stream on this server (in days).
- CPU load – The current load (%) on the server's central processing unit.
- Disks – Indicates if there have been disk errors on the server.
- Network – Indicates if there have been network errors when connecting to other servers.
- Database – Indicates if there have been errors when connecting to the server's database.
- Scripts – Indicates if there have been errors while executing scripts on the server.
- Cameras – Indicates the number of properly-functioning cameras and the total number of cameras.
- Cloud -Indicates if there have been errors when connecting to TRASSIR Cloud service.
- Servers – Indicates the number of properly-functioning servers connected to the network and the total number of servers connected
to the network.
Tip
If even one network server's system health indicates an error, then the "Servers" metric will become red and the server will be considered to be functioning improperly. This parameter is only displayed if TRASSIR Client software is used.
If there are no errors, each metric will be highlighted in green. If an error occurs, then the corresponding line will change to red. There will also be a link to navigate to the appropriate section of the settings. If the system health represents an error but you don't have the necessary permissions to change the server settings, contact the administrator.
Tip
In its collapsed state, the control panel looks like this  . If even one of the system health indicators represents an error, the icon will attract the operator's attention by pulsing
in size, alternately growing larger then smaller.
. If even one of the system health indicators represents an error, the icon will attract the operator's attention by pulsing
in size, alternately growing larger then smaller.
